

For a supplier’s rack-dimension report, statistical control limits specification limits difference is the distinction between what a process is currently doing and what the buyer requires the product to meet. Control limits are calculated from process data and help identify unusual or unstable variation; specification limits come from the customer requirement or approved drawing and define acceptable product boundaries. A process can be stable but still make parts outside specification, or unstable while a sampled set happens to fall within tolerance. Buyers need both views, but they should never treat one as a substitute for the other.
This distinction is useful when sourcing wire baskets, formed brackets, shelves, and other hardware with fit-critical dimensions. It is not a claim about Koitor’s statistical performance. Koitor’s manufacturing expertise includes metal fabrication and sample development; a particular supplier’s process stability, capability, or conformity must be supported by its actual data and the agreed measurement method. The buyer should keep drawing acceptance, process monitoring, and capability analysis separate in purchase decisions.
What are control limits and specification limits?
Control limits are statistical boundaries on a control chart. They are calculated or set from process behavior and help determine whether observed data show evidence of special-cause variation or an unstable condition. A point outside a control limit or a non-random pattern may call for investigation, depending on the chart and rules in use. Control limits are not usually selected to match a drawing tolerance; they describe the data and process under study.
Specification limits are customer-defined requirements, commonly tied to a drawing, contract, product standard, or approved specification. They show the limits within which a measured characteristic is acceptable for the buyer’s intended fit or function. For a rack bracket, a hole position, overall width, wall clearance, or shelf levelness may have a tolerance established by the product design. A supplier should not recalculate a customer’s specification from its own recent production data.
Minitab’s quality guidance describes the difference plainly: control limits represent process variation, while specification limits represent customer requirements. The two answer different questions. A control chart asks, “Is the process behaving consistently enough to interpret its current pattern?” A specification check asks, “Does this measured item meet the agreed requirement?” Capability analysis then compares a stable process’s variation to specification limits under its assumptions. This sequence matters because capability calculations are not meaningful if the process is unstable or the measurement system is unreliable.
Why can a stable supplier process still fail your drawing?
A stable process can operate consistently around a mean that is too close to one tolerance boundary or even outside the acceptable range. If the process remains predictable but its center or spread does not fit the specification, routine control-chart signals may look calm while product risk remains. Control limits can sit entirely outside a buyer’s specification limits, or the process distribution can extend beyond a specification despite no special-cause signal. Stability is a condition for understanding the process; it is not proof of product conformity.
The opposite situation can happen too. A supplier may submit a sample lot in which every observed dimension is within the drawing tolerance, yet the process is unstable because the mean or spread shifts over time. That lot may pass its specific acceptance inspection, but the evidence does not show that future production will behave consistently. A buyer should avoid treating a one-time compliant sample as evidence of ongoing process control.
For bathroom hardware, variation can come from material thickness, forming springback, fixture position, weld sequence, coating build, assembly alignment, or measurement setup. These examples illustrate why a chart must be tied to a defined process and characteristic. A control chart for an overall rack width will not necessarily monitor mounting-hole position or shelf angle. Likewise, control limits derived from one machine, one fixture, or one supplier site do not automatically transfer to a changed route.
| Supplier report statement | What it can mean | What it does not prove | Buyer follow-up |
|---|---|---|---|
| “All points are inside control limits” | No chart rule identified a signal in the displayed data | Every part meets the drawing or the process is capable | Compare data to the approved specification and review chart assumptions |
| “The process is stable” | Observed variation appears predictable under the chosen chart and period | The process mean and spread satisfy the customer tolerance | Review center, spread, specification boundaries, and capability method where appropriate |
| “The sample passed inspection” | Measured sample units met the applicable acceptance rule | Future production is stable or the sample represents all future lots | Confirm sampling plan and supplier process monitoring separately |
| “The control limits equal the drawing limits” | Supplier may have copied customer limits into a chart | That the limits were statistically calculated from process data | Ask for chart setup and distinguish reference lines from calculated limits |
| “Capability is high” | A capability statistic was calculated under stated assumptions | Reliable prediction if the process is unstable or measurement is weak | Request stability evidence, method, period, distribution assumptions, and data scope |
How should buyers read a control chart beside a drawing?
Start with the characteristic, units, drawing revision, and measurement method. Confirm that the chart is monitoring the same feature as the purchase specification. A chart may show subgroups or individual readings; the selected chart type and sampling plan affect how limits are calculated and what patterns it can reveal. If the report omits the time order, subgroup definition, or units, the buyer may not be able to interpret it.
Then verify that the specification limits are the current customer-approved values. A supplier might use an older drawing, internal process target, or tolerance from a different product revision. Ask whether the chart displays specification lines as reference only, and whether the control limits are calculated from actual process data or fixed by an approved method. The two sets of lines should be clearly identified and not represented as interchangeable.
Review the data period and process scope. Do the observations cover a representative production run, or only a short setup window? Did the supplier change material source, tooling, operator, fixture, coating route, or inspection method during the period? Did the chart exclude points, and if so, what was the documented reason? Exclusions or recalculated limits can be legitimate when handled under a defined procedure, but unexplained edits can make a chart look better without improving the process.
For a rack assembly, ask whether the controlled feature is measured before or after finishing and assembly. Coating thickness can affect fit at a slot or mounting interface; assembly can alter the final width or squareness. If the drawing limit applies to the finished product, monitoring an unfinished component may be useful for process control but cannot alone establish final conformity. The supplier should explain how the monitored feature relates to the delivered product.
This is the practical meaning of statistical control limits specification limits difference: control-chart lines help the supplier react to process behavior, while the customer-approved dimensions remain the acceptance boundary for the shipped hardware.
How do control limits relate to capability and acceptance?
Capability indices compare process variation with specification limits, but the interpretation requires appropriate data and assumptions. A stable process is generally a prerequisite for a meaningful capability study. Even then, the statistic depends on sample selection, measurement quality, distribution assumptions, specification accuracy, and whether the chosen period represents the process. Buyers should request the underlying scope and method rather than accept a single number in isolation.
Acceptance inspection is a separate decision. A lot can be accepted or rejected under an agreed sampling plan or inspection requirement regardless of whether a control chart signals a process change. Conversely, a chart can signal a process shift even when the particular sample remains within drawing tolerance. The supplier needs a process reaction plan; the buyer needs a clear product acceptance rule. Both can operate together without being collapsed into one criterion.
If a process is stable but capability is inadequate, discuss adjustment, redesign, tolerance clarification, or process improvement with the supplier and product engineer. Do not quietly widen the acceptance tolerance because a process chart is stable. If a process is unstable, investigate likely special causes before making a capability claim or resetting control limits. If a lot is nonconforming, apply the purchase-order disposition process rather than relying on a chart’s center line.
What should an RFQ or quality agreement specify?
For critical rack dimensions, the buyer should identify which dimensions matter to mounting, fit, packaging, or assembly and provide the approved drawing revision. State units, measurement locations, datum scheme where applicable, post-finish condition, and acceptance limits. Ask the supplier to identify the process characteristic it monitors, chart type, subgroup or sample approach, data frequency, and reaction plan for a signal. If capability reporting is required, specify the data period and reporting basis without prescribing a statistic that is unsuitable for the actual process.
The quality agreement should clarify that control limits are supplier process-monitoring limits and specifications remain customer requirements. It should also state who approves drawing changes, alternative measurements, tolerance concessions, and rework. A supplier should not move specification limits because its control chart shows wider variation. A customer-authorized deviation must be documented separately from a process chart update.
Ask the supplier to preserve traceability among product ID, revision, lot, measurement method, and chart data. Define how special-cause signals, out-of-spec readings, and measurement-system concerns are handled. The supplier’s response may include containment, root-cause analysis, corrective action, remeasurement, or a request for buyer disposition, depending on the contract and actual risk. These are not interchangeable steps: the process response addresses stability, while product disposition addresses affected units.
Common mistakes when comparing supplier reports
Do not compare one supplier’s control limits to another’s as if they were customer tolerances. Each supplier’s limits reflect its own data and process. A wider control band can indicate more observed variation, but the interpretation also depends on chart type, sampling, time period, and scale. Compare the actual performance to the same approved specifications and use a qualified analysis for supplier-to-supplier capability comparisons.
Do not conclude that a supplier is nonconforming solely because a control limit crosses a specification line. That overlap is a warning about potential process risk or capability, not itself a measured nonconforming part. Conversely, do not accept all product as conforming because the chart remains inside control limits. Inspect or assess actual product against the acceptance rule.
Do not change control limits every time a point is inconvenient. Limits may need recalculation after a documented process change or a justified baseline update, but the decision should follow a defined control-chart procedure. If the process changes materially, preserve the before/after context so a report does not conceal a trend. Never use “new limits” to retroactively redefine customer requirements.
Do not confuse a control chart with a tolerance stack-up or fit assessment. A rack that meets individual dimension tolerances may still have an assembly-fit issue if the design stack-up is not understood. The product engineer should define the functional requirement and datum strategy; the supplier then monitors relevant process characteristics and inspection points.

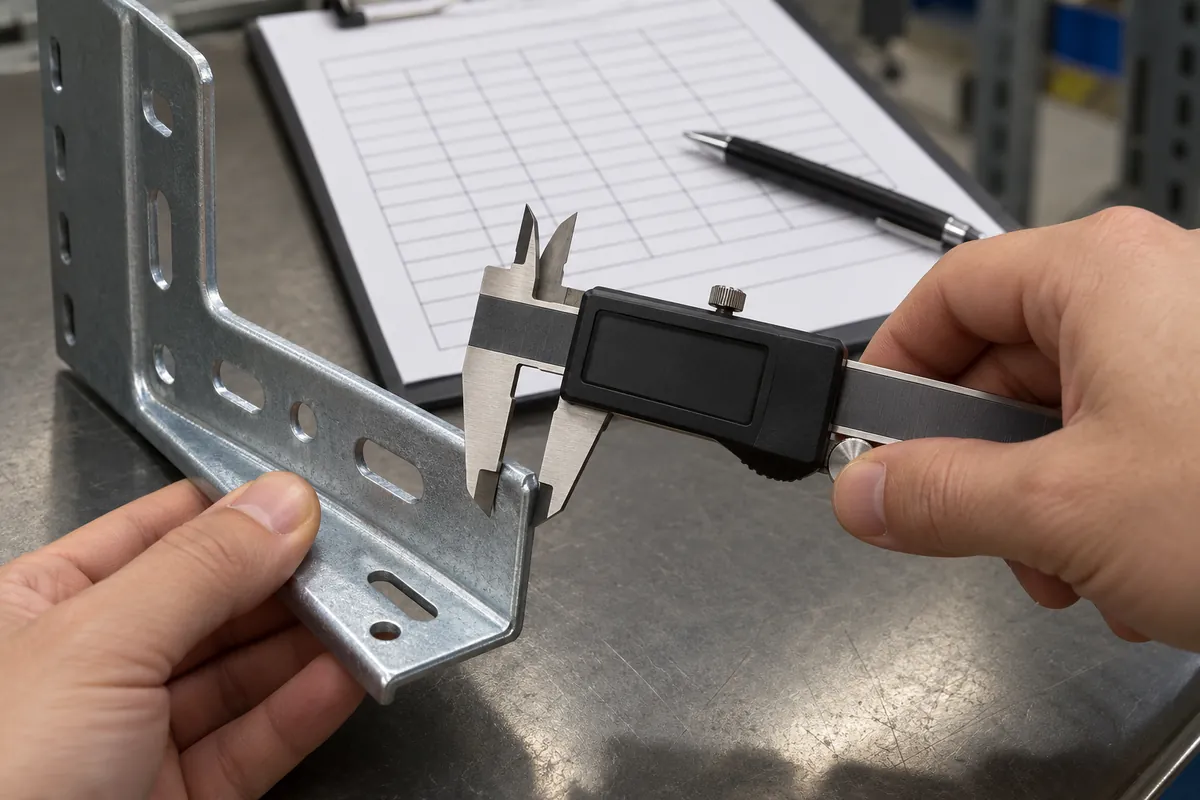
A buyer review checklist
When a supplier submits chart or capability evidence, check that the report names the feature and unit; uses the correct drawing revision and specification limits; identifies chart type, sample plan, and data period; shows control and specification limits distinctly; explains any excluded data or recalculated limits; and states whether process changes occurred. If capability is reported, confirm that stability and measurement quality were reviewed and that assumptions are disclosed. For incoming acceptance, keep the lot sampling and disposition rules separate from process-monitoring logic.
Can the control limit be used as the product tolerance? No. Control limits describe process behavior; specification limits define customer requirements. They may be displayed together, but their meanings remain different.
Can a stable process make out-of-spec racks? Yes. A process can be stable but centered poorly or vary too much relative to the specification. Stability alone does not establish capability or conformity.
Can a sample pass while the process is unstable? Yes. A sample result is evidence about the measured units under the sampling plan; it does not by itself prove future process stability.
Should the buyer choose the supplier’s control limits? Usually the supplier’s limits are calculated under its process-control method. The buyer defines the product specification and can require a monitoring and reaction plan.
What if a supplier says a chart is “within limits” but does not show the drawing tolerance? Ask for both sets of limits and the feature definition. Without the customer specification, a chart cannot answer whether the product meets the buyer requirement.
A practical supplier handoff
A useful review begins with a current drawing, agreed measurement approach, and a short explanation of the intended decision. Ask the supplier to show customer specification limits separately from process control limits and to explain what the chart says about stability, capability, and lot acceptance—three different questions. Record any authorized deviation separately from routine monitoring. This makes supplier reports easier to compare and prevents a stable process chart from being mistaken for product approval.
When reviewing a report, repeat the statistical control limits specification limits difference in the meeting notes and identify which lines are calculated from process data versus copied from the drawing. That simple labeling avoids a recurring source of disagreement between a supplier’s quality team and a buyer’s receiving team.
Koitor can support custom hardware development from drawings or physical samples and help clarify critical dimensions, forming features, assembly interfaces, and packaging requirements. Supplier-specific statistical claims should be based on the actual data and reviewed by a qualified quality owner. To discuss an OEM rack or bathroom hardware project, contact Koitor or review custom OEM home-storage hardware development.
Clarify Process Evidence Before Supplier Approval
Share the product drawing, critical dimensions, inspection approach, and supplier report question. Koitor can review the metal hardware context; process-control conclusions must be supported by supplier data.
OEM / العلامة التجارية الخاصة
حوّل دليل التوريد هذا إلى موجز منتج
يرجى إطلاعنا على المنتج المستهدف، والحجم، والتشطيب، وكمية الطلب، ومتطلبات التغليف. وسيتلقى فريقك تقييمًا عمليًّا لإمكانية التصنيع قبل تقديم عرض الأسعار.

 English
  Español
  Português
  Français
  Deutsch
  العربية